
7 Weekly KPIs Salon Owners Can Check in 15 Minutes
7 Weekly KPIs Salon Owners Can Check in 15 Minutes
Track average ticket, retention rate, retail attach, chair utilization, revenue by service, new client acquisition cost, and net profit margin every single week, and you’ll catch profit and retention problems while they’re still cheap to fix. Pull these seven numbers into one short report every Monday. Most salons that skip this end up diagnosing a slow month in week four, when the damage is already locked in.
TL;DR:
- Tracking retail attach ratios regularly helps identify product recommendation issues before they impact overall profit.
- Keeping client retention rates above 60 to 80 percent ensures steady revenue and early detection of loyalty declines.
- Comparing revenue by service category against margins reveals profitability pitfalls hidden by high-volume, low-margin services.
- Monitoring chair utilization across weekdays uncovers scheduling inefficiencies, guiding shifts and promotions without extra staffing costs.
- Integrating booking, POS, and payment systems streamlines data collection, enabling quick weekly reviews and accurate performance insights.
Table of Contents
- What Are Salon Analytics Metrics and Where Does the Data Come From?
- Core Salon Metrics: What Each KPI Is, the Formula, and Why It Matters
- How to Read Reports and Turn Numbers Into Weekly Actions
- Operational KPIs: Scheduling, No-Shows, and Staff Performance
- Client Intelligence and Retention: LTV, Segmentation, and Win-Back Tactics
- Financial Metrics and Pricing: Service Profitability and Retail Mix
- Benchmarks and Target-Setting: What Good Looks Like
- What to Look for in Salon Analytics Software and Dashboards
- How Exclusively Captures These Metrics Week to Week
- Common Challenges and Pitfalls in Salon Data Collection
- Case Studies: How Salon Analytics Improved Business Outcomes
- How to Integrate Salon Analytics With Booking and POS Systems
- A Publisher’s Take: Start Small, Stay Weekly
- See These Numbers Without the Spreadsheet Chase
- Sources
What Are Salon Analytics Metrics and Where Does the Data Come From?
Salon analytics metrics are the numbers your booking system, point-of-sale terminal, and payment processor generate every time a client checks in, buys a product, or no-shows. Salon analytics software pulls those raw events, appointment records, service tickets, retail sale line items, payment confirmations, and cancellation logs, and turns them into dashboards you can actually read in five minutes.
Three systems feed almost every useful metric: your booking calendar (who’s coming, who canceled, who’s a first timer), your POS (what they bought and for how much), and your payment processor (what actually settled versus what got refunded or disputed). When those three talk to each other, you get a real picture. When they don’t, you’re stuck exporting three spreadsheets and reconciling them by hand, which is exactly why so many salon owners give up on tracking anything past monthly revenue.
The industry has settled on a short list of numbers that matter most. A widely cited framework narrows it to seven core salon KPIs: average service ticket, client retention rate, pre-book rate, retail-to-service ratio, chair utilization rate, new client acquisition cost, and net profit margin. That’s the list worth building a weekly habit around before you add anything fancier.
Core Salon Metrics: What Each KPI Is, the Formula, and Why It Matters
Here’s each metric broken down with the math and the decision it should trigger.
- Average service ticket. Divide total service revenue by number of service transactions in the period. A ticket that’s drifting down usually means price resistance, upselling has stopped, or your service mix has shifted toward cheaper offerings. Fix it with add-on prompts at checkout or a menu review, not a blanket price hike.
- Client retention rate (rebooking). Count clients who returned within your chosen lookback window (60 or 90 days works for most salons) divided by total clients seen in the prior period. A dip here shows up long before revenue does, which is why it deserves a weekly, not quarterly, look.
- Retail-to-service ratio. Retail sales divided by service revenue. Most salons target somewhere in the 8 to 15% range depending on category mix. If it drops, your front desk has stopped recommending products, full stop.
- Chair or provider utilization. Booked hours divided by available hours per stylist. Low utilization on Tuesdays but overbooked Saturdays means your scheduling, not your marketing, is the problem.
- Revenue by service. Break revenue down by service category and compare margin, not just volume. A service that books solid but carries thin margin can quietly drag down profitability while looking like a win on the calendar.
- New client acquisition cost. Marketing spend divided by number of new clients acquired in the period. Compare it against average first-visit ticket to see if you’re paying more to acquire a client than that client is worth on visit one.
- Net profit margin. Net profit divided by total revenue. Every other metric on this list exists to move this one number, so it’s the final check that tells you whether the other six actually worked.
How to Read Reports and Turn Numbers Into Weekly Actions
A weekly routine only works if it’s short enough to survive a busy Monday. Fifteen minutes is the realistic ceiling before your team’s attention drifts.
- Pull last week’s seven KPIs into one screen or printout before your Monday team huddle.
- Flag anything that moved more than 10% in either direction compared to the four-week average.
- Assign one owner to each red flag: front desk handles retail attach, the scheduling lead handles utilization.
- Segment by stylist and by new versus returning client before deciding on a fix.
- Log the action taken so next week you can see if it worked.
Dashboards that break revenue down by service, stylist, and client segment with year-over-year comparisons let you catch a dip while it’s still small, rather than discovering it in a month-end statement that’s already three weeks stale.
Pro Tip: If retail attach drops two weeks in a row, don’t run a discount promo first. Retrain the checkout script, since price is rarely the actual problem.
Operational KPIs: Scheduling, No-Shows, and Staff Performance
Operational numbers determine whether your chairs are making money or just sitting there looking busy on a calendar.
- No-show and cancellation rate. Track cancellations and no-shows as a percentage of booked appointments; anything trending above your baseline calls for a firmer confirmation text or deposit policy.
- Utilization versus idle capacity. Compare booked hours to open hours by day and hour, then move staff shifts or promotions to fill the gaps instead of adding headcount.
- Revenue per stylist. Total revenue generated per provider, useful for fair commission structures and for spotting who needs coaching versus who’s ready for more chair time.
- Service duration versus booked slot. If haircuts are consistently running 10 minutes over their booked slot, you’re bleeding capacity all day without realizing it.
Per-stylist scorecards paired with real-time sales dashboards and client retention metrics make these comparisons fast instead of a Friday-night spreadsheet chore.
Client Intelligence and Retention: LTV, Segmentation, and Win-Back Tactics
Retention is where most of your profit actually lives, since a returning client costs almost nothing to serve compared to a new one.
- Visit frequency. Average days between visits per client. Anyone drifting past their normal interval by 50% or more is an at-risk client worth a personal outreach.
- Lifetime value (LTV). Average ticket multiplied by visit frequency per year multiplied by average years retained. This number tells you the real ceiling on what you can afford to spend acquiring a client.
- Pre-book and rebooking levers. Every client who leaves without a next appointment booked is a coin flip on whether they return at all. Tracking pre-book rate as its own KPI, separate from overall retention, exposes this fast.
- Automated win-back triggers. Set a rule that fires an offer or a personal text once a client passes their normal visit window. Vendor platforms commonly build rebooking and win-back campaign triggers directly into appointment analytics, which turns a manual chase into something that happens automatically.
Financial Metrics and Pricing: Service Profitability and Retail Mix
Revenue tells you what came in. Margin tells you what you actually kept, and the gap between those two numbers is where most salons lose money without noticing.
- Service-level margin. Subtract product cost and stylist time cost from service price to see which services are actually profitable versus just popular.
- Retail-to-service ratio, revisited. If your ratio sits below your salon’s target range, test one specific fix (a bundled retail offer at checkout) for two weeks and measure the delta.
- Short pricing tests. Raise price on one service by 5 to 10% for a month and watch booking volume and average ticket together, not price alone.
- The margin tie-back. Every operational and client metric above ultimately shows up here. A retention win with no margin improvement means you’re retaining unprofitable clients.
Benchmarks and Target-Setting: What Good Looks Like
Numbers without context don’t tell you much.
Retail-to-service ratios in the 8 to 15% range, chair utilization above 70%, and retention rates in the 60 to 80% window are common reference points cited in salon KPI benchmarking guides, though the right target depends heavily on your service mix and market.
Set weekly targets from your own trailing four-week average rather than an industry number pulled from broad market statistics, since your salon’s baseline is the only honest starting point. Improve one KPI by a small, specific amount (2 to 3 percentage points on retention, for instance) rather than chasing a round number that has no connection to your actual data. Skip vanity metrics like total appointments booked unless they’re tied back to margin. If a red flag persists for three straight weeks despite action, that’s your signal to dig into segment-level data instead of guessing again.
What to Look for in Salon Analytics Software and Dashboards
The software question comes after the KPI habit, not before it. A dashboard that doesn’t feed your weekly 15-minute check is just a expensive wall decoration.
- Native integrations with booking, POS, and payments so numbers update without manual exports.
- Real-time or near-real-time reporting. Same-day dashboards let you fix a slow Tuesday before it becomes a slow month; end-of-month PDFs only tell you what already happened.
- Per-stylist and per-service filters so you can segment coaching and promotions instead of treating the whole team the same.
- Exportable, accountant-ready reports. Auto-generated daily, weekly, and monthly reports save real reconciliation time at month-end.
- Client segmentation for win-back campaigns, not just a client list sorted by last visit date.
How Exclusively Captures These Metrics Week to Week
A branded platform earns its place in this workflow only if it actually feeds the numbers above without extra manual work.
- Booking data (appointments, cancellations, pre-book status) flows straight from the calendar into retention and utilization calculations.
- Branded mobile apps and custom websites capture first-visit source and repeat-visit timing automatically, sharpening client intelligence without a separate CRM.
- Square and Stripe payment integrations settle transaction data cleanly, which is what makes exportable, accountant-ready financial reports possible in the first place.
Common Challenges and Pitfalls in Salon Data Collection
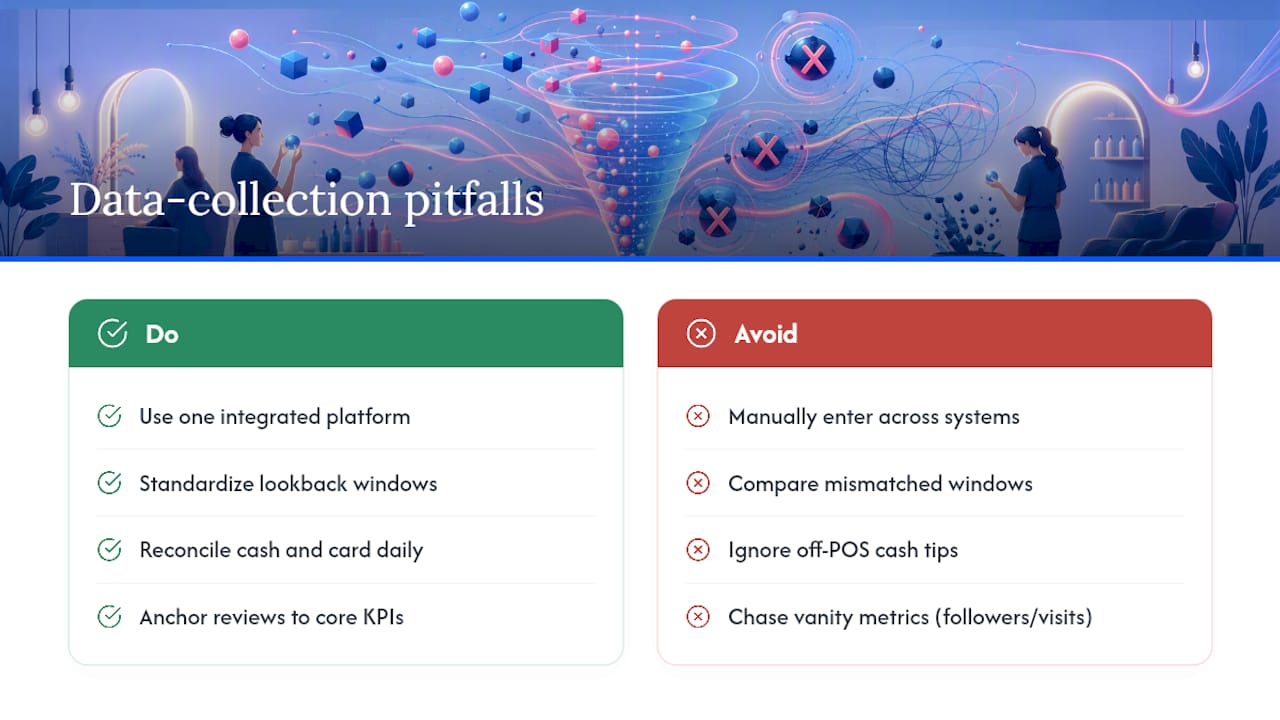
The biggest problem isn’t a lack of data. It’s data scattered across three systems that don’t talk to each other.
Manual entry is the first crack. If your front desk keys retail sales into one system and appointments into another, someone eventually forgets, and your retail attach ratio quietly goes stale. Second, inconsistent lookback windows create false alarms; comparing this week’s retention against a 90-day window last month against a 60-day window this month makes a stable business look volatile.
Cash and card mismatches trip up a lot of owners too. If a stylist collects a cash tip that never touches the POS, your revenue-per-stylist number understates their actual contribution. Multi-location salons face a sharper version of this: without a shared platform, each location’s utilization and retention numbers live in separate silos, and the owner ends up averaging spreadsheets by hand every month.
The last pitfall is chasing metrics that feel important but don’t move margin. Total appointments booked, social media followers, and website visits all look good in a monthly recap, but none of them tell you whether last Tuesday’s slow afternoon was a scheduling issue or a marketing one. Anchor every review to the seven core KPIs first, and treat everything else as secondary color, not the main event.
Case Studies: How Salon Analytics Improved Business Outcomes
The cause turned out to be a new front-desk hire who hadn’t been trained on product recommendations. A single script fix brought the ratio back within three weeks, recovering retail revenue that would otherwise have gone unnoticed until the next quarterly review.
Another common pattern shows up around chair utilization. Shifting a single stylist’s schedule or running a Tuesday-only promotion closes that gap without adding payroll.
Retention data tells a similar story. Salons using automated win-back triggers tied to visit frequency, rather than manual follow-up calls, report catching at-risk clients closer to their natural rebooking window instead of months after they’ve already switched salons. The mechanism is simple: a system that flags a client the day they cross their usual interval acts faster than any front-desk memory ever could.
How to Integrate Salon Analytics With Booking and POS Systems
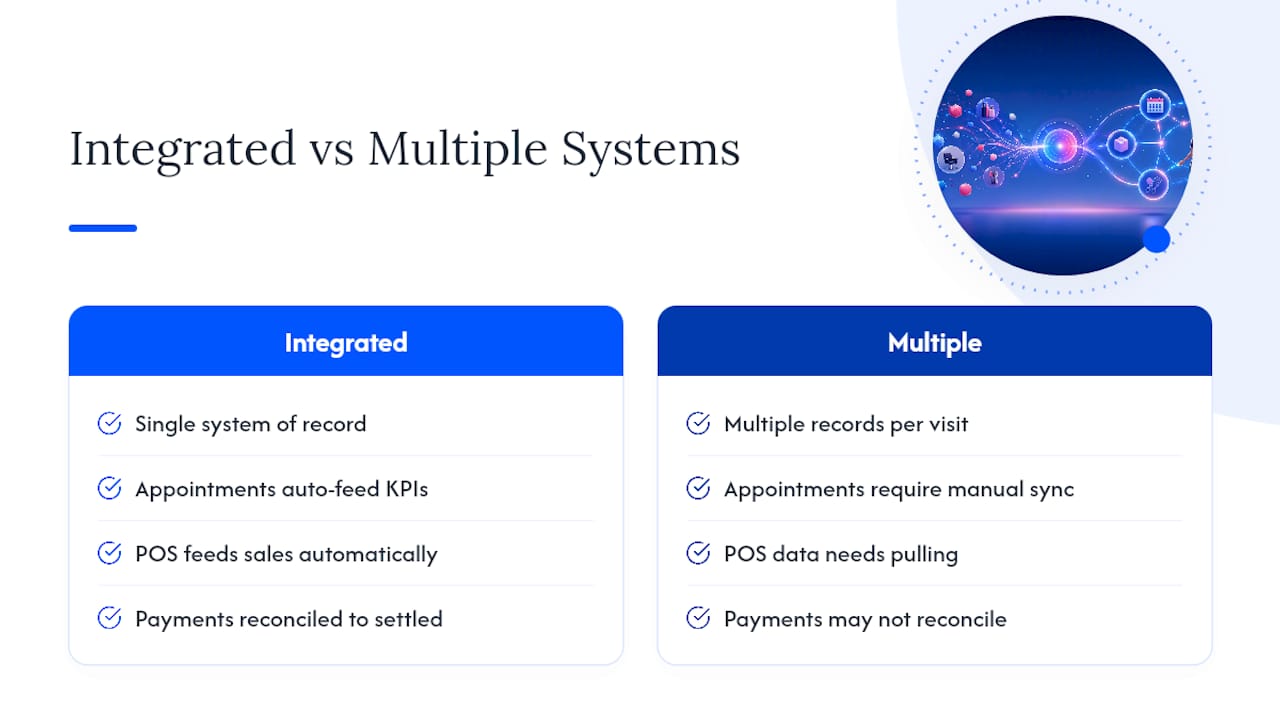
Integration starts with picking one system of record for appointments and letting everything else pull from it, rather than re-entering the same client visit three separate times.
Your booking calendar should feed retention, utilization, and pre-book metrics automatically the moment an appointment is completed or canceled. Your POS should feed average ticket, retail attach, and revenue-by-service the moment a sale closes. Payment processors like Square and Stripe should reconcile against both, so financial KPIs match what actually settled rather than what was quoted at checkout.
The practical test is simple: if generating your weekly report requires opening more than one system and copying numbers by hand, the integration isn’t finished. A platform built around a single client and appointment record, with payments attached directly, removes that copy-paste step entirely, which is the difference between a five-minute Monday report and a forty-minute one.
A Publisher’s Take: Start Small, Stay Weekly
Most salons don’t fail their analytics because the software is wrong. They fail because they try to track thirty metrics on day one and abandon the habit by week three. Start with the seven KPIs above, on a spreadsheet if that’s all you have, and review them every Monday with whoever runs your front desk. Add a platform once the habit sticks and the spreadsheet starts feeling like the bottleneck, not before.
— Service
See These Numbers Without the Spreadsheet Chase
Everything covered above depends on your booking calendar, POS, and payment data actually talking to each other, and certain integrated platforms close that gap. A platform with a branded website, mobile app, booking system, and payment integration can consolidate client records, helping update your average ticket, retention rate, and retail attach numbers automatically instead of relying on disconnected exports.
If you’re comparing platforms, see how the feature set stacks up against SQUIRE or check current pricing for websites, booking, and mobile apps. Ready to see your own weekly numbers in one place? Book a call and walk through your specific setup.
Sources
For broader market context, Statista tracks industry-level statistics worth cross-checking against your own benchmarks. On the marketing side, this piece on analytics and marketing ROI digs into how tracking spend against outcomes sharpens acquisition-cost decisions.
- Salon KPIs: 7 Numbers to Track Weekly (2026 Guide)
- Revenue Analytics Dashboard for Salons | AI Business Intelligence | Prefero